Written by LetsBuild
Last updated September 19, 2023
Follow us
A Gantt chart is an essential element of most major construction projects these days. Named after the American engineer, Henry L. Gantt, who came up with the idea in the early part of the 20th century, in simple terms it is a bar chart used to display the details of a construction job to help manage it and deliver it on time.
Often, the chart will show the task to be performed on the vertical axis and the time interval on the horizontal axis.
It will include things like when aspects of the scheme should start and completed – and what each of those aspects involves.
It is believed one of the first significant applications of Gantt charts was by the United States during the First World War. For many years, Gantt charts were written out on paper. Magnetic blocks and Lego pieces became popular as a Gantt planning tool before personal computers and software for Gantt became widespread. The use of technology has obviously meant Gantt charts have become easier to manipulate and use.
With the advent of digital tools, Gantt charts have managed to evolve and provide plenty of features and functionalities to the users. Gantt chart software can play a decisive role in connecting the boardroom with the construction site and improving the communication between the numerous project agents.
For example, a user can add milestones, create task dependencies and schedule a set of project objectives (i.e. critical path of a project) based on the latest data. It becomes easily clear, then, that the use of a reliable Gantt Chart software can have a significant impact on a project planning and management process.
Many stakeholders in construction used to rely on local desktop systems (eg. Microsoft Project) to streamline their project but that is now changing. People understand the value of working in an open and collaborative Gantt chart where all project participants can exchange information and updates in real time.
Real-time construction management can pave the way for fast and effective collaboration with less admin and mental burden. And most important, it can give all project agents the certainty that they have all the information they need to complete their tasks on time and on budget.
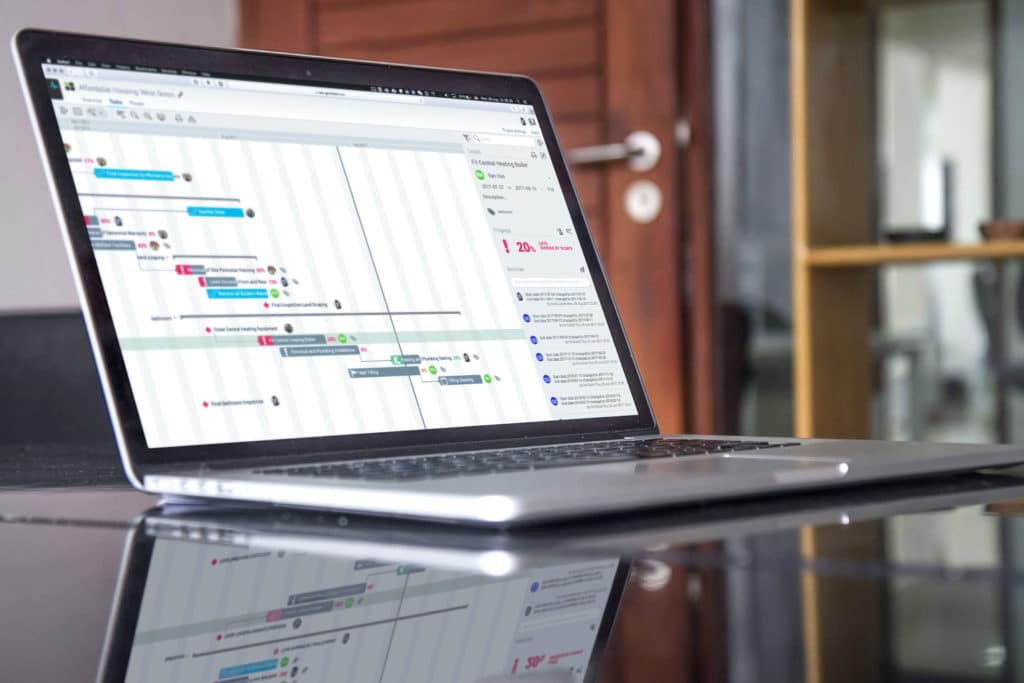
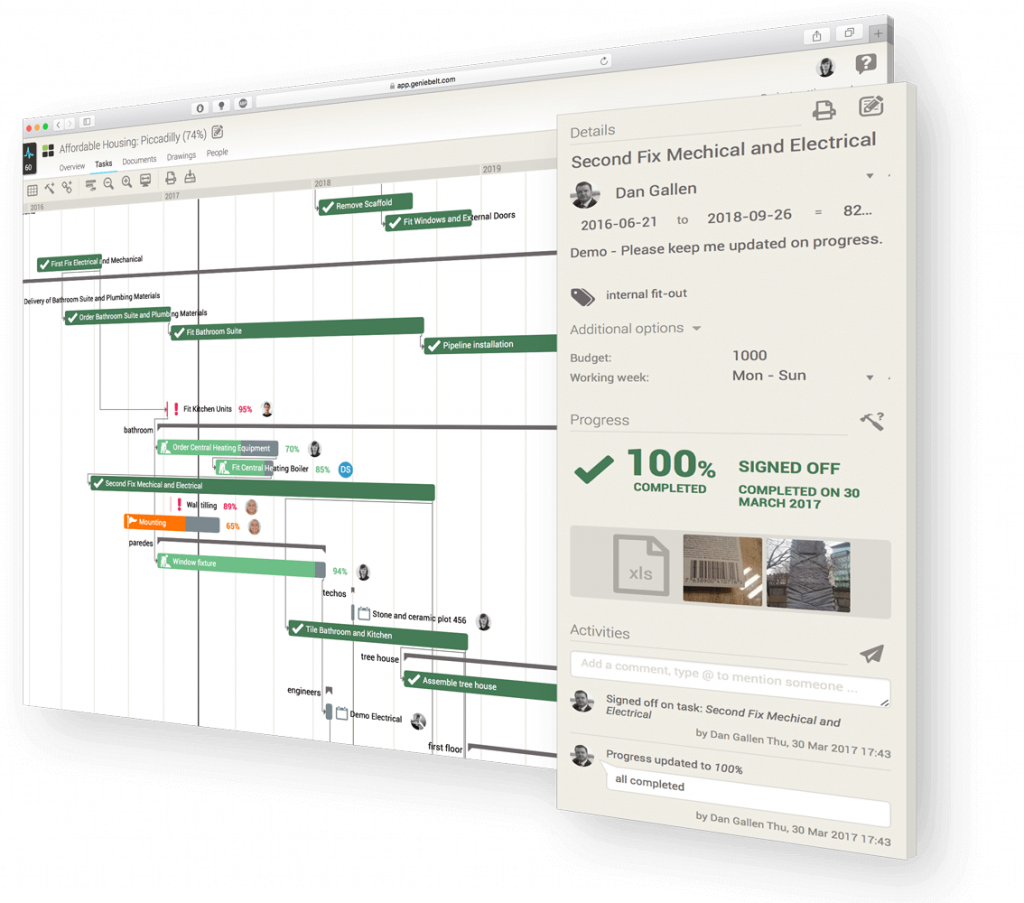
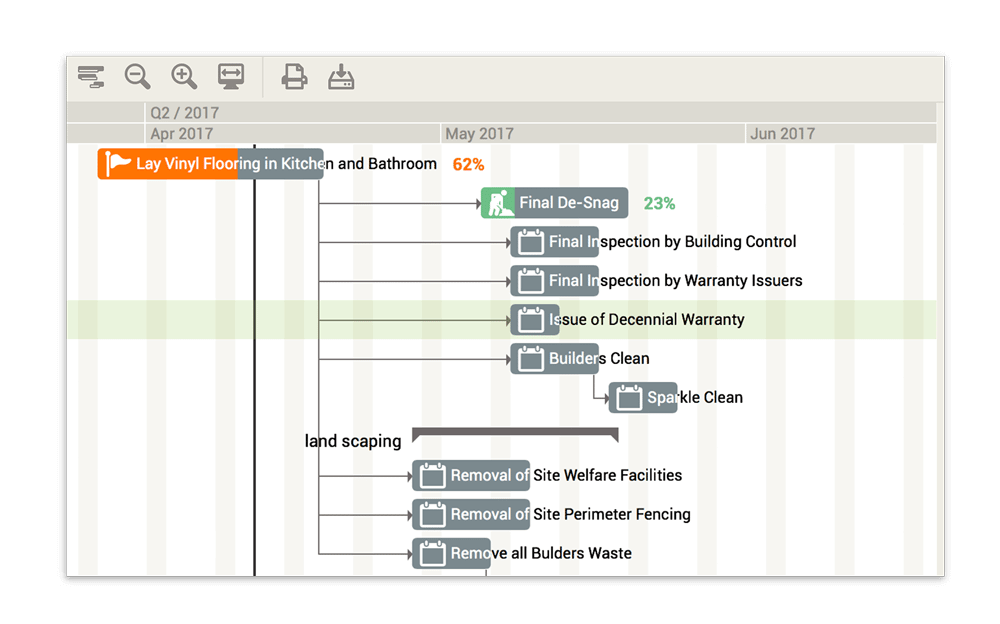
Below you can see how a Gantt chart looks like in LetsBuild’s tool:
The long-standing popularity of the Gantt chart is understandable. There are many advantages to using it. It is tried and tested and it is a relatively simple method of making sure that a project runs smoothly and stays on track.
A big part of the attraction is the simplicity of a Gantt chart – it is a very easy way to visualise if a project progresses as it should. In addition, Gantt charts support data-driven decision making and direct communication between the different sides.
The graph can help identify possible problems with the schedule and where the pinch points will, or are, occurring.
It also means that you are normally able to stop resource overload from occurring. Within a Gantt chart, you can delegate jobs to different individuals and align team resources without bombarding people. Obviously, if resources are correctly managed, there is more chance of a project completing on time.
The other advantage is the method can take some of the stress out of the project as a whole. If you are not constantly worrying about the timetable on your project, that frees you up for more important problem-solving issues and allows you to concentrate on getting the job over the line on budget and on time.
A Gantt chart can also offer clarity for the rest of the team so everybody understands what they are meant to be doing. That can have a great effect on reducing rework rates and delays.
And a final, very attractive, advantage is that a system like this can actually help you reduce costs. If a project manager has total oversight of resources and timescales, they are much more likely to be in a position to make efficiencies.
With the use of software, Gantt charts can also be easily updated and this can be done in real time with the click of a button. It doesn’t take much to understand that with the rise of digital solutions Gantt charts have become much more powerful and agile allowing people on and offsite to connect faster and more effectively.
The great thing is that a team can share all their thoughts, tasks and objectives with everybody else working on the project. It also means people should understand their roles and responsibilities – there is a strong element of transparency. A Gatt chart should also encourage feedback, again hopefully helping everything stay on track.
Gantt charts are popular in construction but are also used by many other industries, for anyone looking to plan a project – be it for IT, marketing or education.
So what’s the best way to build a Gantt chart? Before you start properly, you’ll probably want to look at the options you have in terms of software for drawing up a chart. The basic dilemma is desktop vs online software. Desktop software is more suited for one manager, who may not necessarily want to share the project with others. It normally involves just one license per user so can end up expensive.
On the other hand, online software is a lot easier to share and lays the ground for a more collaborative approach. Some online software companies operating in this area offer handy options such as email alerts which flag to team members when a new task has been created or is due.
The costs are often less than desktop software too – so in most cases it makes more sense to just use online software.
When it comes to compiling a Gantt chart, whatever software you’re using, the best place to start is drawing up a list of all the tasks you have in front of you. Flag up what will be the earliest start and the approximate timeframe for each job. If the tasks run in order, it’s best to spell out which stages they depend on.
Then add in graphs with either the days or weeks up until the end of the project. At this point, you should plot your objectives and tasks onto the graph. Write in each job on the graph indicating the earliest likely start date and the estimated time of completion.
Now you need to prepare a schedule for your tasks. The key here is to ensure that your dependent activities do not begin before the tasks they depend on are finished. After this, you should draw up the final version of the chart that should ideally show when the project will start and finish.
So are there any downsides to using a Gantt chart? Some have raised concerns about using the method on projects that have more than 30 activities. A critical path method (CPM) could be a better approach in this case. Also, it’s worth bearing in mind that Gantt charts do not necessarily illustrate just how complex a project can be.
Another element to keep in mind is how detailed you make your Gantt chart. Listing things like meetings or review processes may not always be the best thing as this can add a layer of confusion.
At the end of the day, what really matters is finding the Gantt chart software that suits your needs best. This depends on a number of factors such as the type of your project, the number of people involved, your budget and your end goal.
In any case, though, a reliable Gantt chart software can make a big difference for your project regardless of the few disadvantages that might come with it.
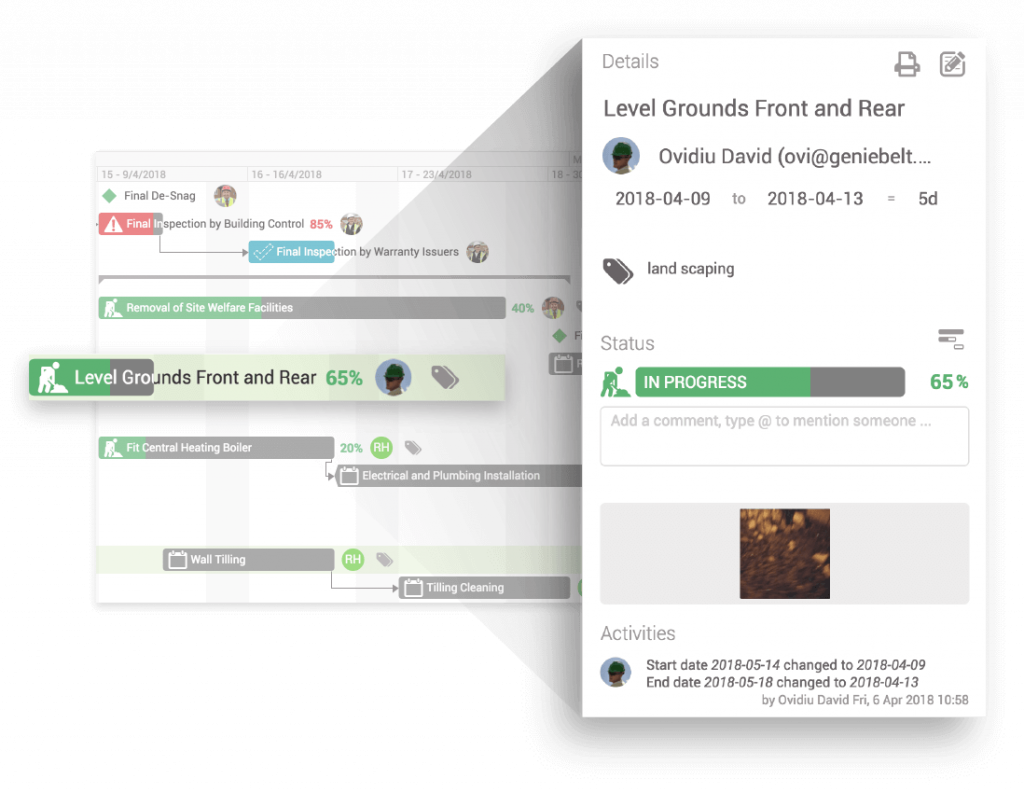
By now, it is evident that Gantt charts can transform the construction process in a number of ways and contribute to an open and highly-collaborative ecosystem in construction. Here you can take a taste of how a Gantt chart in LetsBuild’s tool looks like and the perks that come with it:
Our Gantt chart enables you to collaborate in real time and monitor effortlessly the progress of your project. It’s cloud-based and allows stakeholders to access both current and old tasks across different projects.
Furthermore, it’s an interactive Gantt chart which can be used to track timing and delays in the field. By using LetsBuild’s tool, you will also be able to easily assign tasks and import programmes from other digital solutions such as Microsoft Project or Primavera.
In that way, you can have the flexibility you need while managing multiple projects.
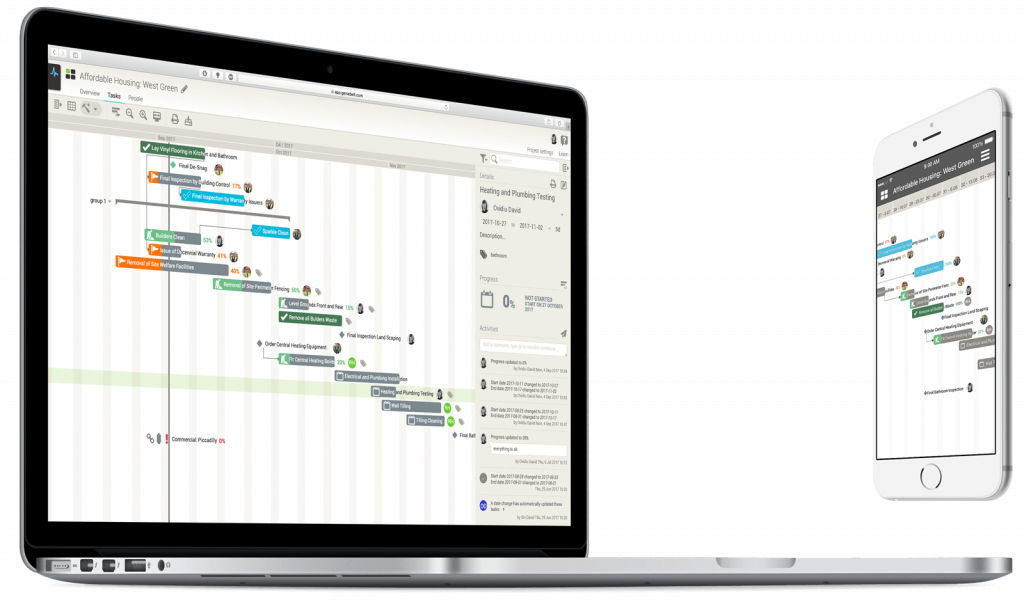
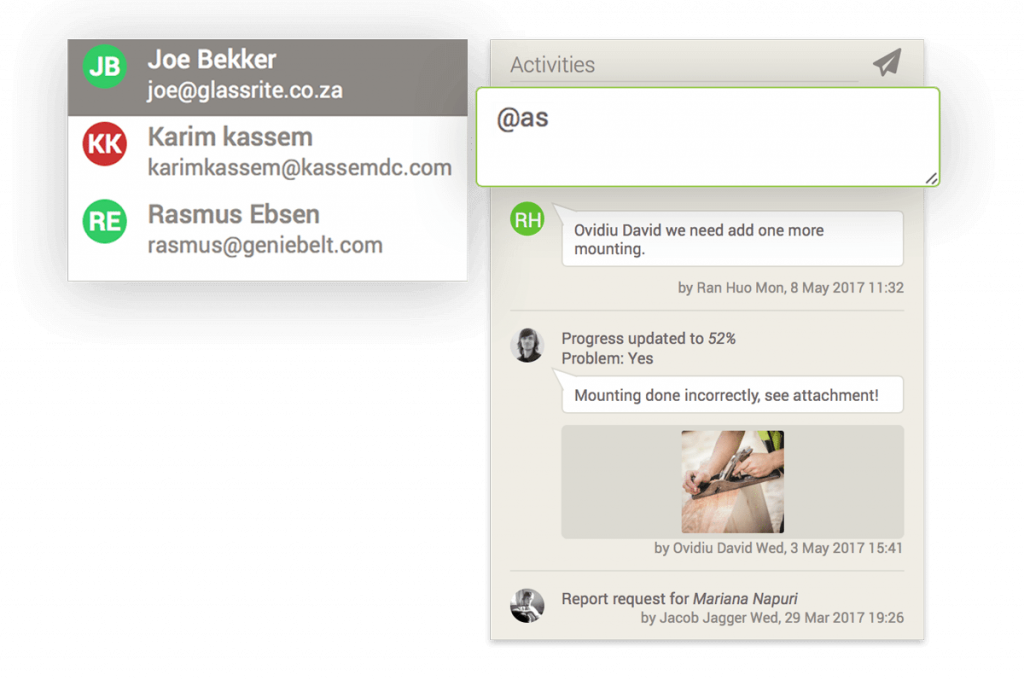
 Instant communication from site to office and effective collaboration
Having access to your Gantt chart through your mobile or tablet device can bridge the gap between the construction site and the office. The ability to report progress and last-minute changes with the click of a button can help substantially in reducing mistakes during the building process and responding in crisis situations much faster.
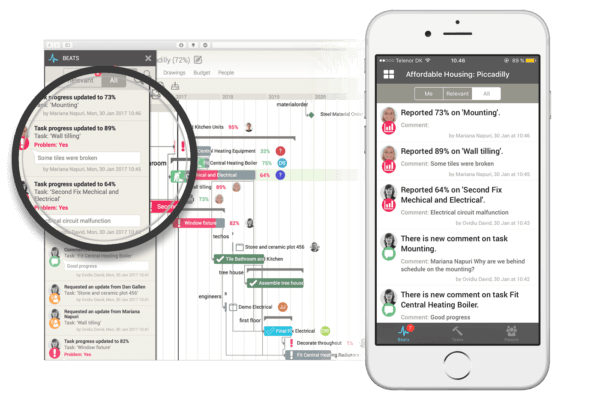
 Fewer emails and calls
For many project managers in construction, staying on top of their inbox and voicemail is a real challenge. A reliable Gantt chart can remove this heavy burden off your shoulders and help you focus on what matters the most.
Moreover, the ability to receive progress reports, updates and documents or photos through LetsBuild’s platform, it can drastically reduce the number of emails and calls that stakeholders in construction have to manage.
At the same time, everyone can stay up-to-date with the latest progress on their tasks and complete them without you being obliged to call or message them on a constant basis.
 Enhanced operational efficiency
Thanks to LetsBuild Gantt chart, you can improve the operational efficiency of your teams in three simple ways:
It’s no secret that construction projects come with a lot of admin and mental burden. This is an area where LetsBuild’s Gantt chart can really change things for the better. In a nutshell, here are some of the main ways this could be achieved:
 Accountability, transparency and a full audit trail
Thanks to our built-in, real-time audit trail, project managers can get even more out of their Gantt charts in the following ways:
 Gain back control of your projects
As you can see there are plenty of positives to knowing how to properly compile and use a Gantt chart in construction. With deadlines and money always foremost in a project manager’s mind, they are more than worth getting your head around – or getting the latest software.
With the right digital solution and Gantt chart, you have the opportunity to take back control of your projects and operate within time and budget. Like that, you will be able to clearly and quickly see if a project is developing as it should.
In the long run, this will allow you to improve your delivery, have more proactive meetings and reduce the micro-management that comes with paperwork. This increased transparency and accountability could pave the way for a more efficient building process with fewer budget overruns and project delays.